We published a paper in Psychological Assessment a few weeks ago, and I would like to take the time to explain what these results imply. You can find the full text here, the analytic code (R & Mplus) including the output of all models here (scroll down to the paper), and while I am not allowed to share the data we re-analyzed, I wrote some pointers on how to apply for the datasets here.
In contrast to other blog posts, this will be a quiz: in the paper, we find a very consistent pattern of violations of temporal measurement invariance (I will explain in a second what that means), in different datasets, but we don’t really have a good idea what causes this pattern of observations.
In contrast to other quizzes, however, there is no prize because … we don’t know what the true answer is as of yet ;).
So what did we do in the paper?
We examined two crucial psychometric assumptions that are part of nearly all contemporary depression research. We find strong evidence that these assumptions do not seem to hold in general, which impacts on the validity of depression research as a whole.
What are these psychometric assumptions? In depression research, various symptoms are routinely assessed via rating scales and added to construct sum-scores. These scores are used as a proxy for depression severity in cross-sectional research, and differences in sum-scores over time are taken to reflect changes in an underlying depression construct. For example, a sum-score of symptoms that supposedly reflects “depression severity” is often correlated to stress or gender or biomarkers to find out what the relationship between these variables and depression is; this is only valid if a sum-score of symptoms is actually a reasonable proxy for depression severity. In longitudinal research, if a sum-score decreases from 20 points to 15 points in a population, we conclude that depression improved somewhat. This is only valid if the 20 points and the 15 points reflect the same thing (if the 20 points would reflect intelligence and the 15 points neuroticism, the difference of 5 points over time would be meaningless).
To allow for such interpretations, rating scales must (a) measure a single construct, and (b) measure that construct in the same way across time. These requirements are referred to as unidimensionality and measurement invariance. In the study, we investigated these two requirements in 2 large prospective studies (combined n = 3,509) in which overall depression levels decrease, examining 4 common depression rating scales (1 self-report, 3 clinician-report) with different time intervals between assessments (between 6 weeks and 2 years).
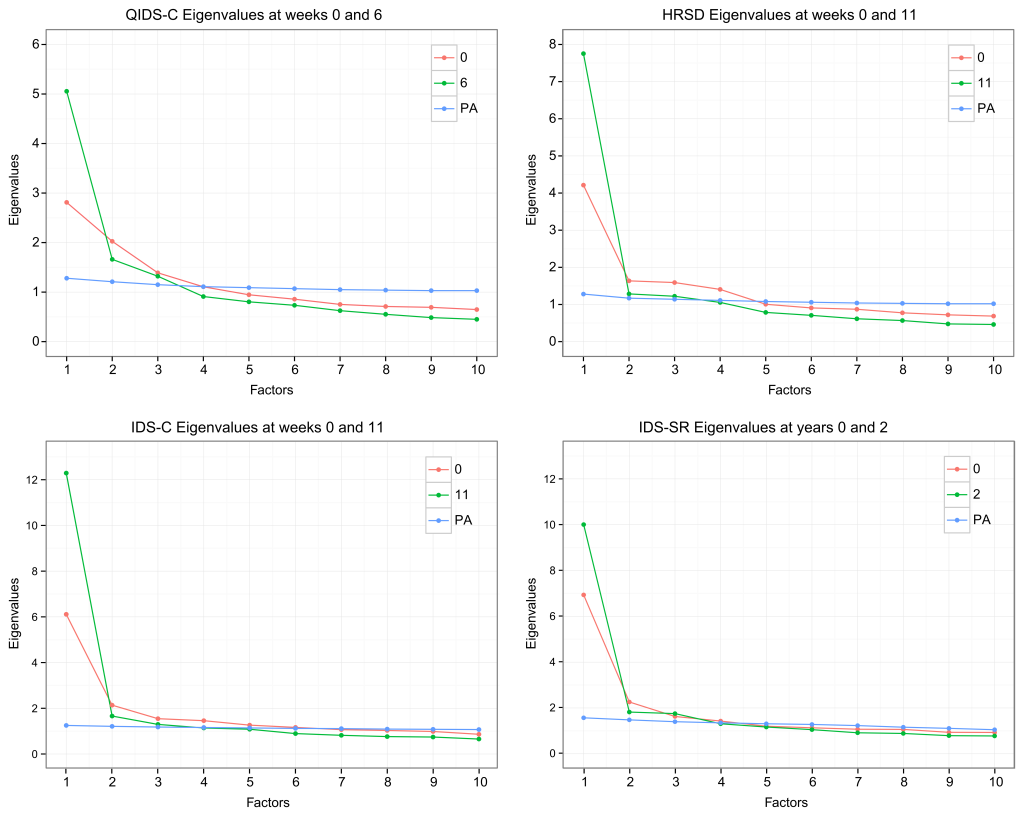
A consistent pattern of results emerged. For all instruments, neither unidimensionality nor measurement invariance appeared remotely tenable. At least 3 factors were required to describe each scale (this means that the sum-score does not reflect 1 underlying construct, but at least 3 and sometimes up to 6), and the factor structure changed over time. Typically, the structure became less multifactorial as depression severity decreased (without however reaching unidimensionality). The decrease in the sum-scores was accompanied by an increase in the variances of the sum-scores, and increases in internal consistency.
You can see the results in the graph below. The four sections represent four different rating scales, the lines represent the first (red) and second (green) measurement point of the longitudinal datasets, PA (blue) means parallel analysis which tells us how many factors a scale has at a given timepoint, and the x-axis represents the number of factors that have to be extracted. If our red and green data lines are above the blue PA line, it means that we should extract a factor. You can read up on all the ESEM modeling in the paper itself, but the gist is that in order to be unidimensional, a scale must only have 1 factor; and as you can see, all scales require the extraction of at least 3 factors. In order to be measurement invariance, the factor solution has to be stable across time; it’s highly evident from the graphs that this is not the case, because the lines for the 2 measurement points per scale should roughly overlap if this were the case (do me the favor and click on the image, I can’t embed vector graphics here). For a scale to be unidimensional and measurement invariant, the red and green line should be very similar, and they should be above the blue line for the first factor and then drop below the blue line for the second etc factors.
These findings challenge the common interpretation of sum-scores and their changes as reflecting 1 underlying construct. In other words, summing up symptoms to a total score, and correlating this total score statistically with other variables such as risk factors or biomarkers, is very questionable if the score itself is not unidimensional and does not reflect 1 underlying construct (depression). Obviously, if you have worked with depression symptoms before you know that they are very different from each other, and the idea that they are interchangeable indicators of 1 condition (depression) is very problematic. But now we have empirical evidence that this is the case — which is consistent with many other papers that have shown similar results. The special thing about this paper is that we examined these properties across a whole range of scales, and tested the robustness of the results by varying many dimensions (datasets, clinician- vs patient-rated, and timeframes).
But what is the reason for these violations of temporal invariance? In the paper, we discuss a number of possibilities that we all exclude as sufficient explanations. Among these are response shift bias, regression towards the mean, selection bias, floor and ceiling effects of items, and that item responses over time may have been influenced by medication.
As we say in the paper:
Overall, these possibilities unlikely fully explain the causes of the pronounced and consistent shifts of the factorial space observed in this report, although they may each contribute somewhat. In other words, while we have provided a thorough description of the crime scene, we have no good idea who the main suspect may be.
The violations of common measurement requirements are sufficiently severe to suggest alternative interpretations of depression sum-scores as formative instead of reflective measures. A reflective sum-score is one that indicates an underlying disorder, the same way having a number of measles symptoms tells us that you have measles: the symptoms inform us about a problem because the problem caused the symptoms. A formative sum-score, on the other hand, is nothing but an index: a sum of problems. These problems are not meant to reflect or indicate an underlying problem. Still, we can learn something from such a sum-score: the more problems people have, the worse they are probably doing in their lives.
» Fried, E. I., van Borkulo, C. D., Epskamp, S., Schoevers, R. A., Tuerlinckx, F., & Borsboom, D. (2016). Measuring Depression over Time … or not? Lack of Unidimensionality and Longitudinal Measurement Invariance in Four Common Rating Scales of Depression. Psychological Assessment. Advance Online Publication. (PDF) (URL)